Kafka

4 posts in this section

Design an Ad Click Event Aggregation System

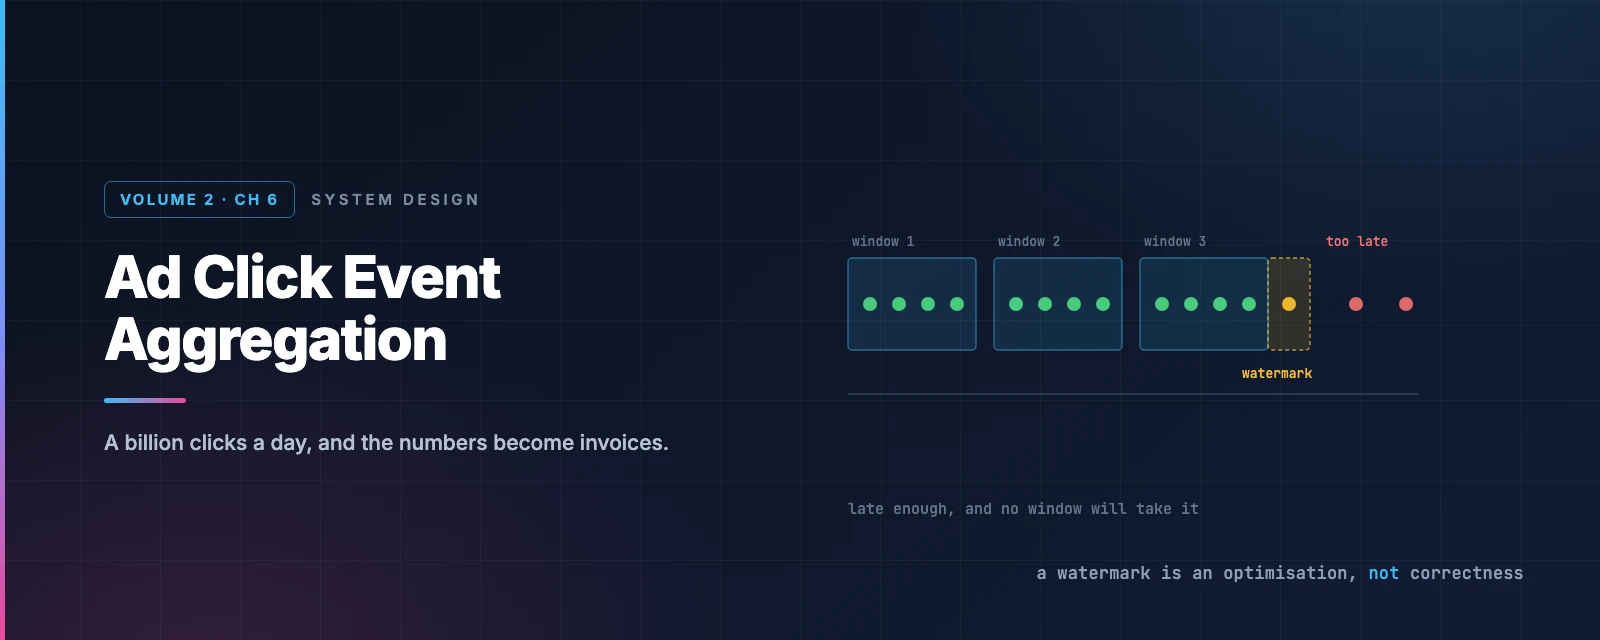
Most systems in this series can lose a little data and survive. A dropped metric leaves a gap on a chart. A missed location update is corrected 30 seconds later.

This one is different, and the difference changes everything: these numbers become invoices.

Ad click aggregation decides how much advertisers pay and how much publishers earn. A 1% error on a billion clicks a day is millions of dollars, in someone’s favour, every month. That single fact is why this design reaches for exactly-once processing — which we spent the last chapter establishing is expensive and usually unnecessary.

Continue reading »
Design a Metrics Monitoring and Alerting System

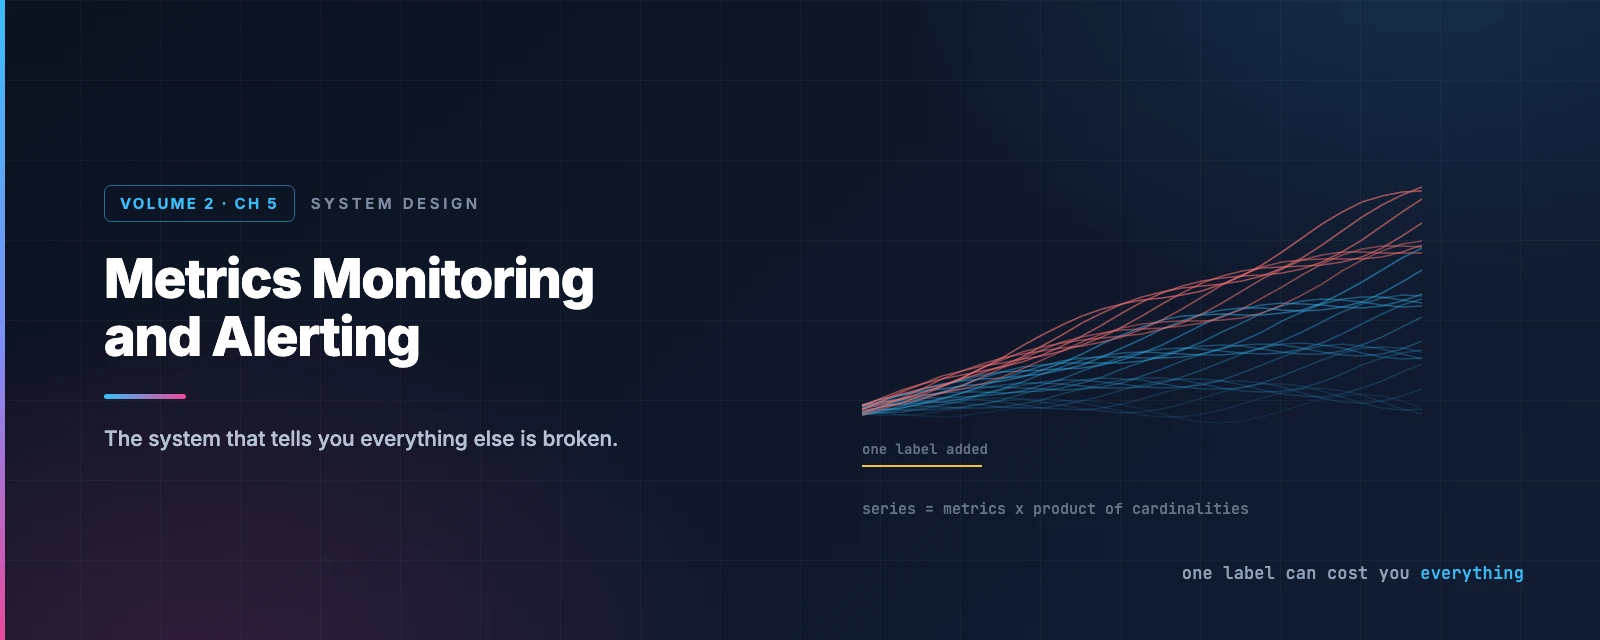
Monitoring is the system that tells you every other system is broken. Which means when it fails, it fails at exactly the moment you need it — and it fails silently, because the thing that would have told you is the thing that’s down.

We’re building an internal metrics platform: 1,000 server pools, 100 machines per pool, 100 metrics per machine — roughly 10 million metrics, retained for a year.

Continue reading »

Design a Distributed Message Queue

A message queue sits between two services so they don’t have to know about each other. The producer writes and moves on; the consumer reads when it’s ready. Neither has to be up when the other is.

That buys you four things: decoupling, independent scaling of each side, availability when one side is down, and asynchronous communication so nobody blocks.

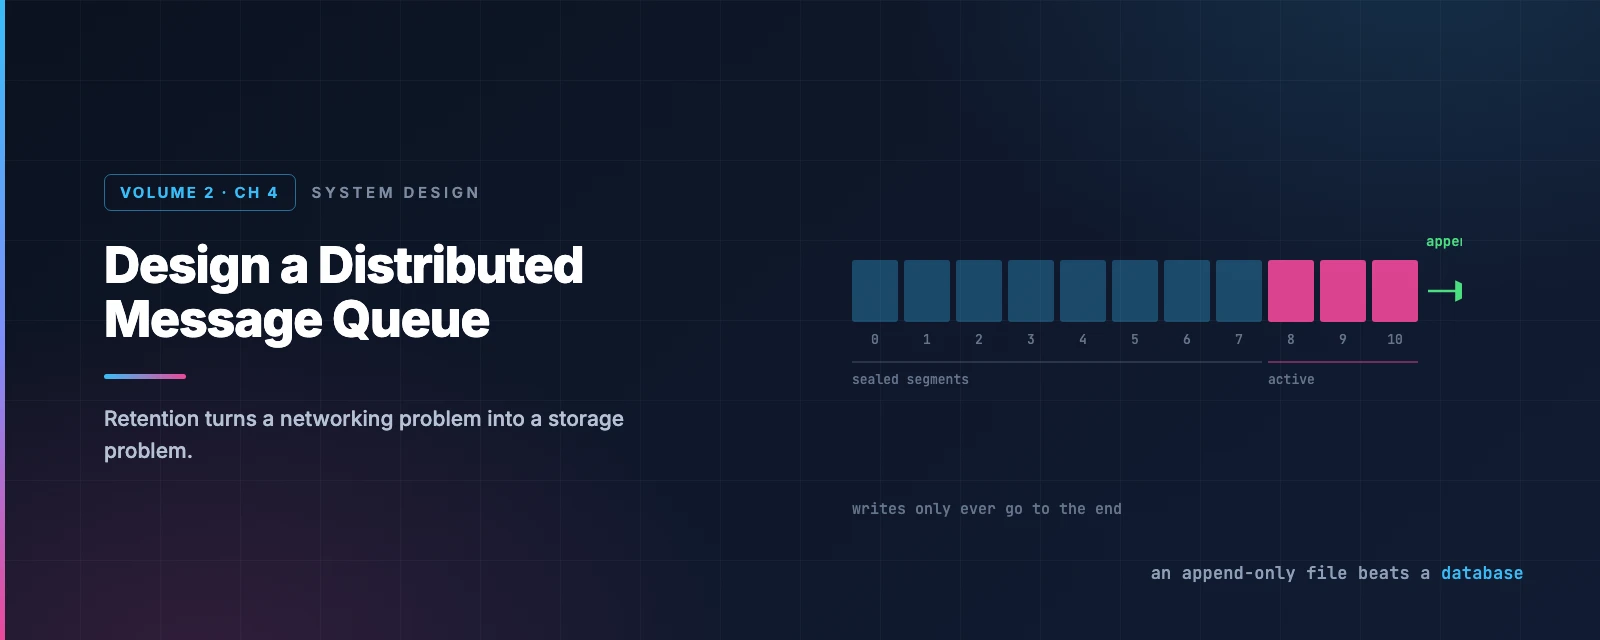
Simple enough to describe in a sentence. The design is not simple at all, and the reason is that we’re going to build the harder version: not just a queue that hands messages over and forgets them, but one that retains everything for two weeks and lets consumers read it again from any point.

Continue reading »

Design Google Maps

Google Maps has about a billion daily active users, covers 99% of the world, and takes in something like 25 million updates a day.

We’re going to build a simplified version. Three features:

  1. Location updates — the client reporting where you are
  2. Navigation — a route from A to B, with an ETA
  3. Map rendering — the actual map on your screen

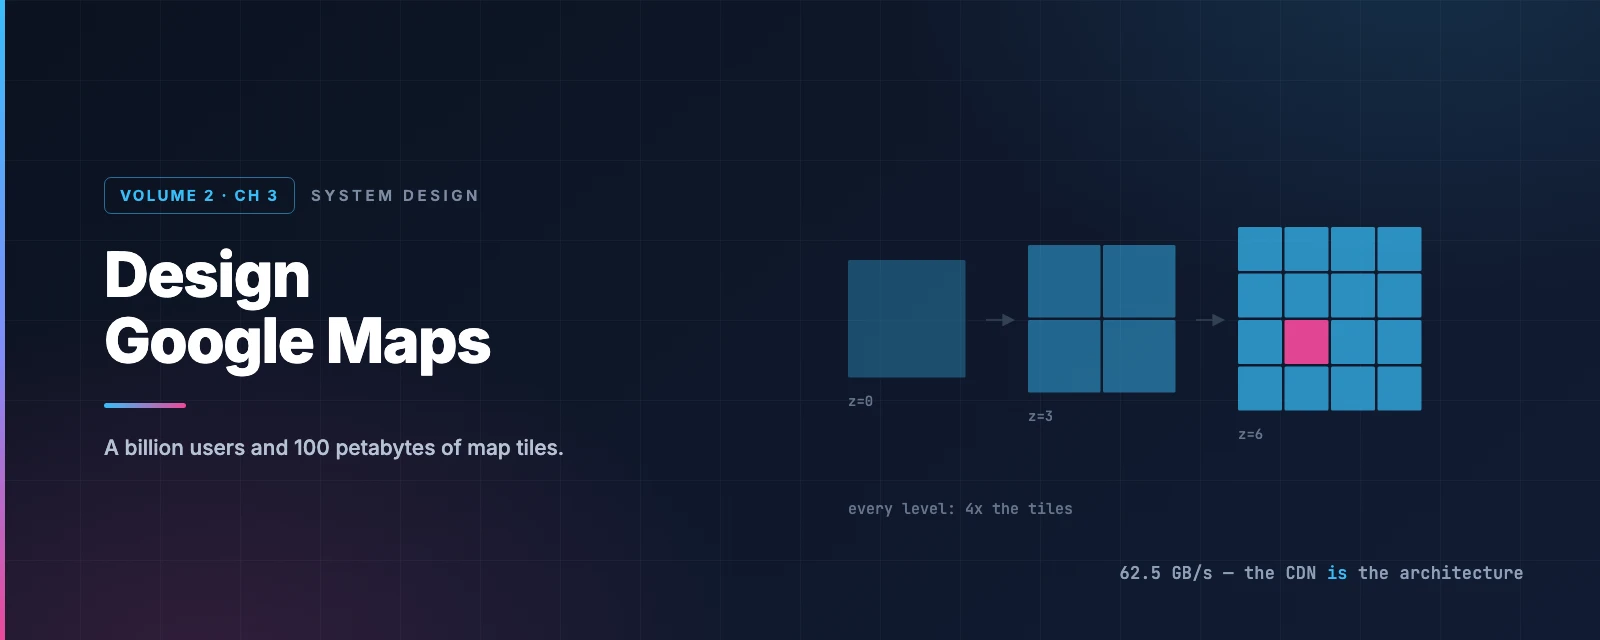
Each one turns out to be a different kind of problem. Rendering is a storage and CDN economics problem. Navigation is a graph algorithms problem, and the graph is far too large to hold in memory. Location updates are a write throughput problem — a million per second at peak.

Continue reading »